X-Ray Physics Made Simple: kVp, mAs, Density, and Contrast
Why the Acquisition–Display Distinction Matters
Technique factors determine the X-ray spectrum and how much radiation reaches the image receptor. They also affect patient dose and image noise. But on a modern digital system, processing can make images acquired at very different detector exposures look similarly bright. A light or dark display is therefore not, by itself, evidence of underexposure or overexposure. Review anatomy, positioning, collimation, motion, image noise, the standardized exposure index (EI) and deviation index (DI)—or the system's legacy proprietary indicator—and the validated target range before deciding whether a repeat is justified.
Replace the Old “Golden Rule”
mAs mainly controls photon quantity and detector exposure; kVp changes beam energy, penetration, output, subject contrast, and scatter. In digital radiography, neither one directly controls displayed brightness or displayed contrast. This distinction helps prevent exposure creep and supports dose optimization.
Four Image Properties—With Digital Terminology
Detector exposure and noise
More detected photons generally improve quantum signal-to-noise ratio. EI estimates detector exposure under defined conditions; it is not a patient-dose measurement.
Contrast
Subject contrast depends on anatomy, beam quality, scatter, and contrast media. Display contrast also depends strongly on processing, lookup tables, and window settings.
Spatial resolution
Detector sampling, focal-spot blur, geometry, and motion all matter. A smaller focal spot and less motion usually reduce unsharpness; longer SID reduces geometric magnification when other geometry is fixed.
Distortion
Size and shape distortion depend on source, object, and receptor geometry. Accurate alignment and minimizing object-to-image distance usually reduce distortion.
kVp—Beam Energy, Penetration, and Output
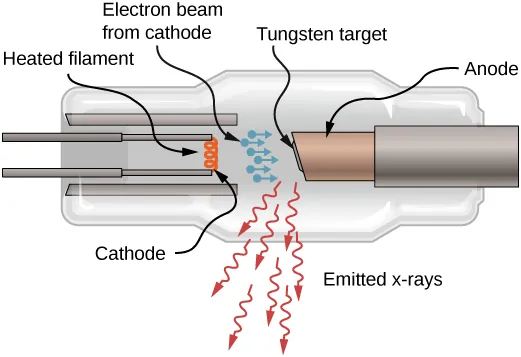
Kilovoltage peak (kVp) is the peak potential applied across the tube. Increasing it raises maximum photon energy, changes the spectrum, generally increases tube output, and increases penetration. It commonly reduces subject contrast and increases the scatter fraction for a given patient and field, but the magnitude is task- and system-dependent. Digital processing can remap the resulting receptor signal, so “kVp controls image contrast” is an incomplete film-era shortcut.
The 15% Rule Is an Approximation
The “15% rule” treats about a 15% kVp change as producing approximately twice or half the detector exposure under otherwise comparable conditions. It is a practical teaching estimate, not a fundamental law: generator waveform, starting kVp, filtration, patient thickness and composition, field size, grid, detector response, and AEC can change the result. A percentage decrease is also not the mathematical inverse of the same percentage increase.
Worked Estimate—not a Universal Prescription
Starting from 70 kVp at 10 mAs, the classroom estimate for a 15% increase is 80.5 kVp with about 5 mAs to keep detector exposure similar. The combination may reduce entrance-surface dose in some examinations, but it can change subject contrast, scatter, organ dose, and lesion detectability. Change clinical techniques only through an optimized, validated protocol or technique chart—not from this example alone.
mAs—Tube Loading and Photon Quantity
Milliampere-seconds (mAs) = tube current (mA) × exposure time (s). At fixed kVp, filtration, geometry, and generator performance, X-ray output and incident detector air kerma are approximately proportional to mAs: doubling mAs approximately doubles them. It does not double digital brightness, optical density, image quality, or patient dose in every circumstance. Patient dose metrics depend on beam quality, field size, geometry, anatomy, and other factors.
Equal mAs and Exposure Time
100 mA × 0.10 s and 200 mA × 0.05 s both equal 10 mAs and generally produce similar output on a calibrated projection-radiography unit within its operating ratings. The shorter exposure can reduce motion unsharpness; it does not inherently improve detector resolution. Tube loading, focal-spot selection, generator accuracy at short times, AEC operation, and equipment limits can prevent exact reciprocity. This simple projection-radiography relationship must not be transferred wholesale to CT or radiotherapy.
The Inverse Square Law and Distance
For an isotropic point source in free space, intensity is inversely proportional to distance squared. A diagnostic X-ray focal spot with collimation closely approximates this relationship at normal projection-radiography distances:
I₁ / I₂ = (D₂ / D₁)²
Distances must be measured from the same source point to the same type of measurement plane. Doubling source distance gives approximately one-quarter the intensity at that plane. The law does not by itself describe attenuation or scatter in a patient.
SID Compensation Example
Changing SID from 100 cm to 180 cm gives I₂/I₁ = (100/180)² ≈ 0.309. Under comparable beam, field, patient, grid, and receptor conditions, the estimate is:
mAs₂ = mAs₁ × (SID₂/SID₁)² = 10 × (180/100)² = 32.4 mAs.
This aims to maintain detector exposure—not displayed brightness or a fixed patient dose. Changing SID can also alter magnification, source-to-skin distance, air gap, field coverage, and scatter.
Digital Brightness, “Density,” and Contrast
Radiographic density properly describes optical blackening on film. In digital radiography, use displayed brightness for image appearance and detector exposure/EI for the receptor signal. Processing largely normalizes brightness and contrast; excessive exposure can therefore look acceptable while increasing dose, whereas insufficient exposure more often appears noisy. EI and DI must be interpreted using the detector manufacturer’s definitions and examination-specific target—not as direct patient-dose values.
| Observation | What it can mean | Safe response |
|---|---|---|
| Image looks light or dark | Display/windowing, processing, segmentation, or acquisition error | Do not prescribe an mAs change from brightness alone; inspect EI/DI, histogram/field recognition, anatomy, and protocol. |
| Image is noisy | Too few detected photons is one possibility; scatter, processing, or detector problems can also contribute | Assess diagnostic adequacy and EI/DI against the local target before changing or repeating exposure. |
| Contrast appears too low | Subject contrast, scatter, processing, or display window may be responsible | Check processing and collimation first; alter kVp or grid use only according to a validated protocol. |
| EI is high | Detector exposure may exceed target, but EI is not patient dose | Review centring, collimation, anatomy, calibration, and technique trends; do not repeat solely to correct EI. |
Scatter, Collimation, and Grids
Compton scatter generated in the patient can reach the receptor and reduce subject contrast. Larger irradiated volumes generally produce more scatter. Tighter, anatomy-appropriate collimation usually reduces both irradiated tissue and receptor scatter, improving contrast and supporting dose optimization. Electronic cropping changes only the displayed border and is not a substitute for physical collimation.
An anti-scatter grid preferentially removes oblique scatter but also absorbs some primary radiation. Maintaining detector exposure therefore usually requires more mAs and can increase patient dose. Grid ratio alone does not determine the increase. The Bucky factor is:
B = mAs with grid / mAs without grid for the same detector exposure under specified conditions.
| Grid decision | Physics consequence | Clinical control |
|---|---|---|
| Add a grid | Less scatter reaches the detector; some primary radiation is also lost | Use only when its contrast benefit justifies the dose cost for the patient size and task. |
| Change grid or beam conditions | Bucky factor changes with grid construction, kVp/beam quality, patient thickness, field size, and geometry | Use manufacturer data and a locally validated technique chart—not a universal ratio-to-mAs table. |
| Miscentre, tilt, reverse, or use outside focal range | Grid cut-off can reduce or make detector exposure non-uniform | Follow grid alignment, orientation, and focal-distance limits. |
Filtration, Beam Hardening, and Dose
Inherent and added filtration remove preferentially low-energy photons, increase mean beam energy and half-value layer (HVL), and reduce output. Low-energy photons contribute dose while being unlikely to reach the receptor. For the same detector exposure, appropriate added filtration can reduce entrance-surface dose, but may require increased mAs and may reduce subject contrast. Filtration therefore must meet equipment regulations and be optimized for the examination; mammography has separate beam-quality requirements. U.S. federal performance standards specify minimum HVL by operating potential rather than endorsing one universal added-filter thickness for every system.
Accurate One-Page Summary
- mAs ↑ → output and detector exposure approximately ↑ proportionally, if other conditions stay fixed; digital brightness need not change.
- kVp ↑ → energy, penetration, and output generally ↑; subject contrast generally falls and scatter fraction may rise, while displayed contrast depends on processing.
- Distance ↑ → intensity at a plane ↓ by approximately 1/d²; square-law mAs compensation targets detector exposure, not display brightness or patient dose.
- Smaller physical field → less tissue irradiated and usually less scatter, supporting contrast and dose optimization.
- A grid can improve contrast but usually costs dose; its Bucky factor is condition-specific, not fixed by grid ratio.
- Filtration removes low-energy photons and hardens the beam; technique, contrast, and dose effects require examination-specific optimization.
- The 15% rule is only an estimate; validated technique charts, EI/DI targets, AEC calibration, and local protocols govern clinical changes.
Sources
- International Atomic Energy Agency. Diagnostic Radiology Physics: A Handbook for Teachers and Students (2014), especially Chapters 5–7 and 23. Full IAEA PDF.
- American Association of Physicists in Medicine Task Group 116. An Exposure Indicator for Digital Radiography, AAPM Report 116 (2009).
- U.S. Food and Drug Administration performance standard, 21 CFR §1020.30, Diagnostic x-ray systems and their major components, including beam-quality/HVL requirements.
- Seibert JA, Morin RL. The standardized exposure index for digital radiography: an opportunity for optimization of radiation dose to the pediatric population. Pediatric Radiology. 2011;41(5):573–581. doi:10.1007/s00247-010-1954-6.
- Allen E, Hogg P, Ma WK, Szczepura K. Fact or fiction: an analysis of the 10 kVp “rule” in computed radiography. Radiography. 2013;19(3):223–227.
Test Your Knowledge
Try these ARRT-style multiple choice questions based on this article. Click an option to check your answer — correct answers turn green, wrong ones turn red.
75 × 1.15 = 86.25, rounded here to 86 kVp; the teaching estimate pairs that increase with half the mAs (10 mAs). Actual detector response and dose depend on the system, patient, geometry, filtration, field, and grid, so clinical changes require a validated protocol.
Square-law compensation: mAs₂ = mAs₁ × (SID₂/SID₁)² = mAs × (180/100)² = mAs × 3.24. This estimates detector exposure, not displayed brightness or patient dose.
Digital post-processing and display settings largely determine brightness. Evaluate EI/DI in its system- and examination-specific context, image noise, anatomy, positioning, collimation, and processing; do not repeat or prescribe a technique change from brightness alone.