MRI — Magnetic Resonance
MRI exploits the quantum mechanical property of proton spin to generate detailed soft-tissue images — without any ionizing radiation. It offers unparalleled contrast resolution for the brain, spine, joints, and abdominal organs.
Clinical images: Wikimedia Commons contributors under CC BY / CC BY-SA / public domain licenses.
How Protons Make Images
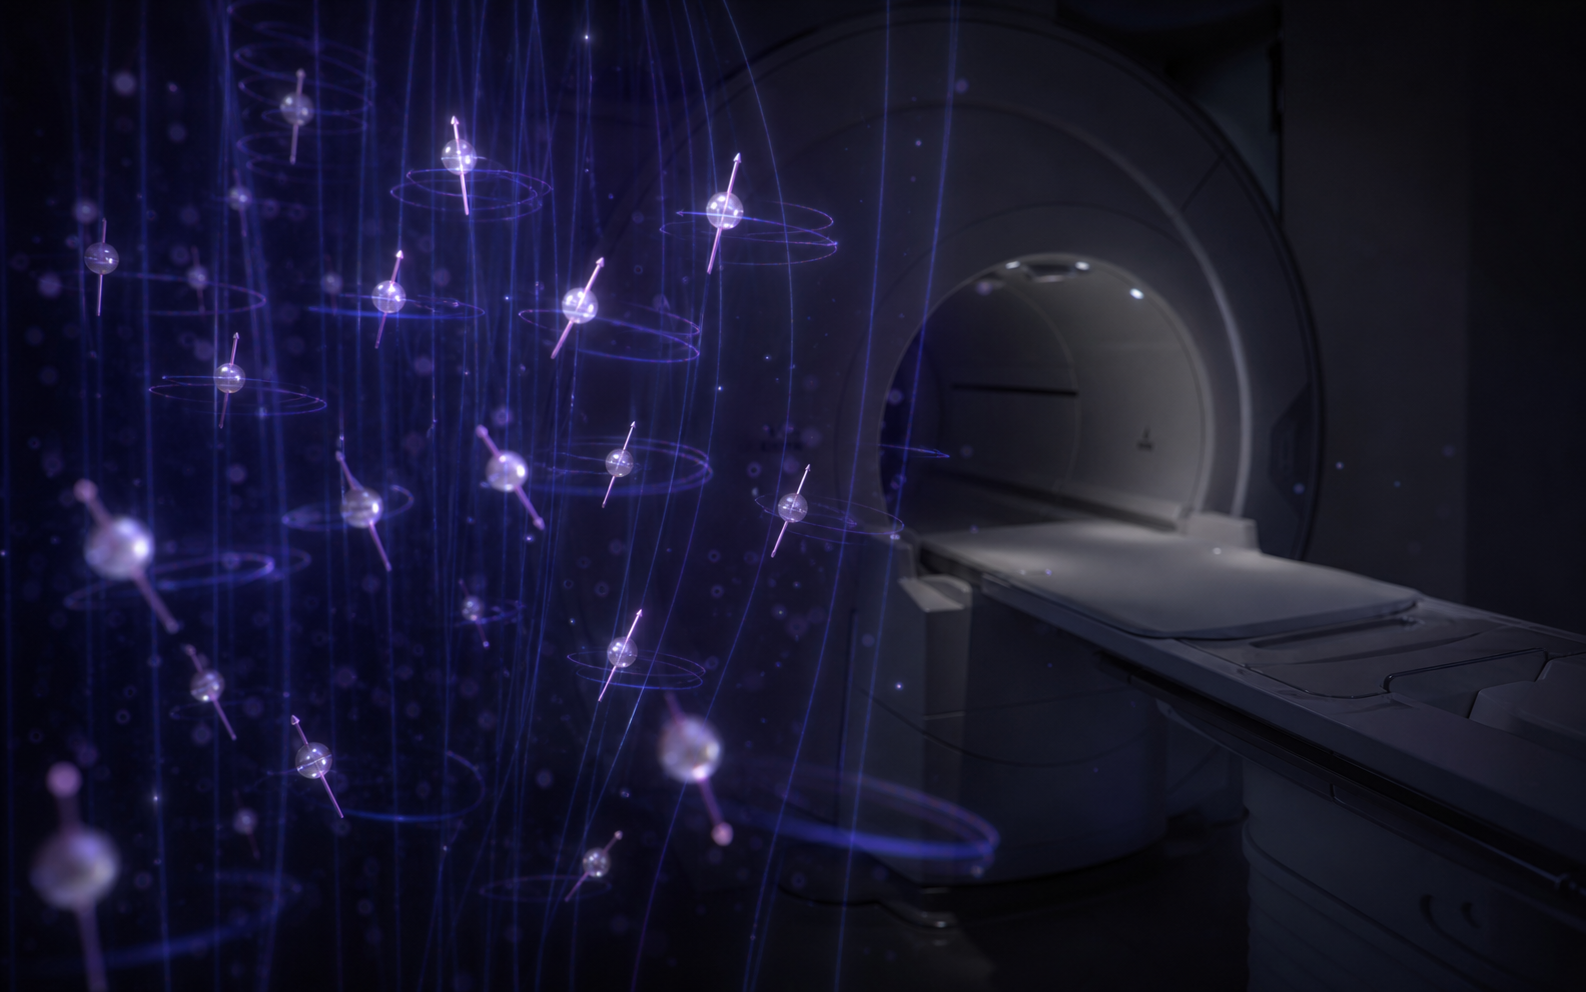
The human body is ~70% water. Each water molecule contains two hydrogen atoms, each with a single proton at its nucleus. Protons possess an intrinsic quantum property called spin — they act like tiny bar magnets.
MRI is based on Nuclear Magnetic Resonance (NMR) — the response of atomic nuclei (mainly ¹H) to magnetic fields and radiofrequency (RF) pulses.
- Step 1 — Alignment: Inside the bore (B₀ field), protons align with or against the magnetic field. Net magnetization vector (M) forms along B₀ axis.
- Step 2 — Resonance: An RF pulse at the Larmor frequency (ω₀ = γ × B₀) tips M away from B₀ axis.
- Step 3 — Relaxation: When RF pulse is off, protons return to equilibrium through T1 and T2 relaxation, emitting RF signal.
- T1 (longitudinal relaxation): Time for Mz to recover to 63% — reflects energy exchange with surrounding lattice (tissue-dependent).
- T2 (transverse relaxation): Time for Mxy to decay to 37% — reflects dephasing due to spin-spin interactions.
- Larmor equation: ω₀ = γ × B₀ (γ for ¹H = 42.58 MHz/T)
When the RF pulse matches the proton Larmor frequency, energy transfers efficiently and the net magnetization tips away from B₀. That transverse magnetization is what the receive coil can detect.
Typical T1 & T2 Values at 1.5T
| Tissue | T1 (ms) | T2 (ms) | T1-weighted | T2-weighted |
|---|---|---|---|---|
| Fat | 200–300 | 80–120 | Bright | Intermediate |
| White Matter | 780 | 90 | Bright | Intermediate |
| Grey Matter | 920 | 100 | Intermediate | Intermediate |
| CSF / Water | 3000+ | 2000+ | Dark | Bright |
| Muscle | 1000 | 50 | Dark–Intermediate | Dark |
| Cortical Bone | Very long | Very short | Dark | Dark |
Click any labeled layer to learn its function. Layout is a simplified front cross-section of a cylindrical superconducting scanner.
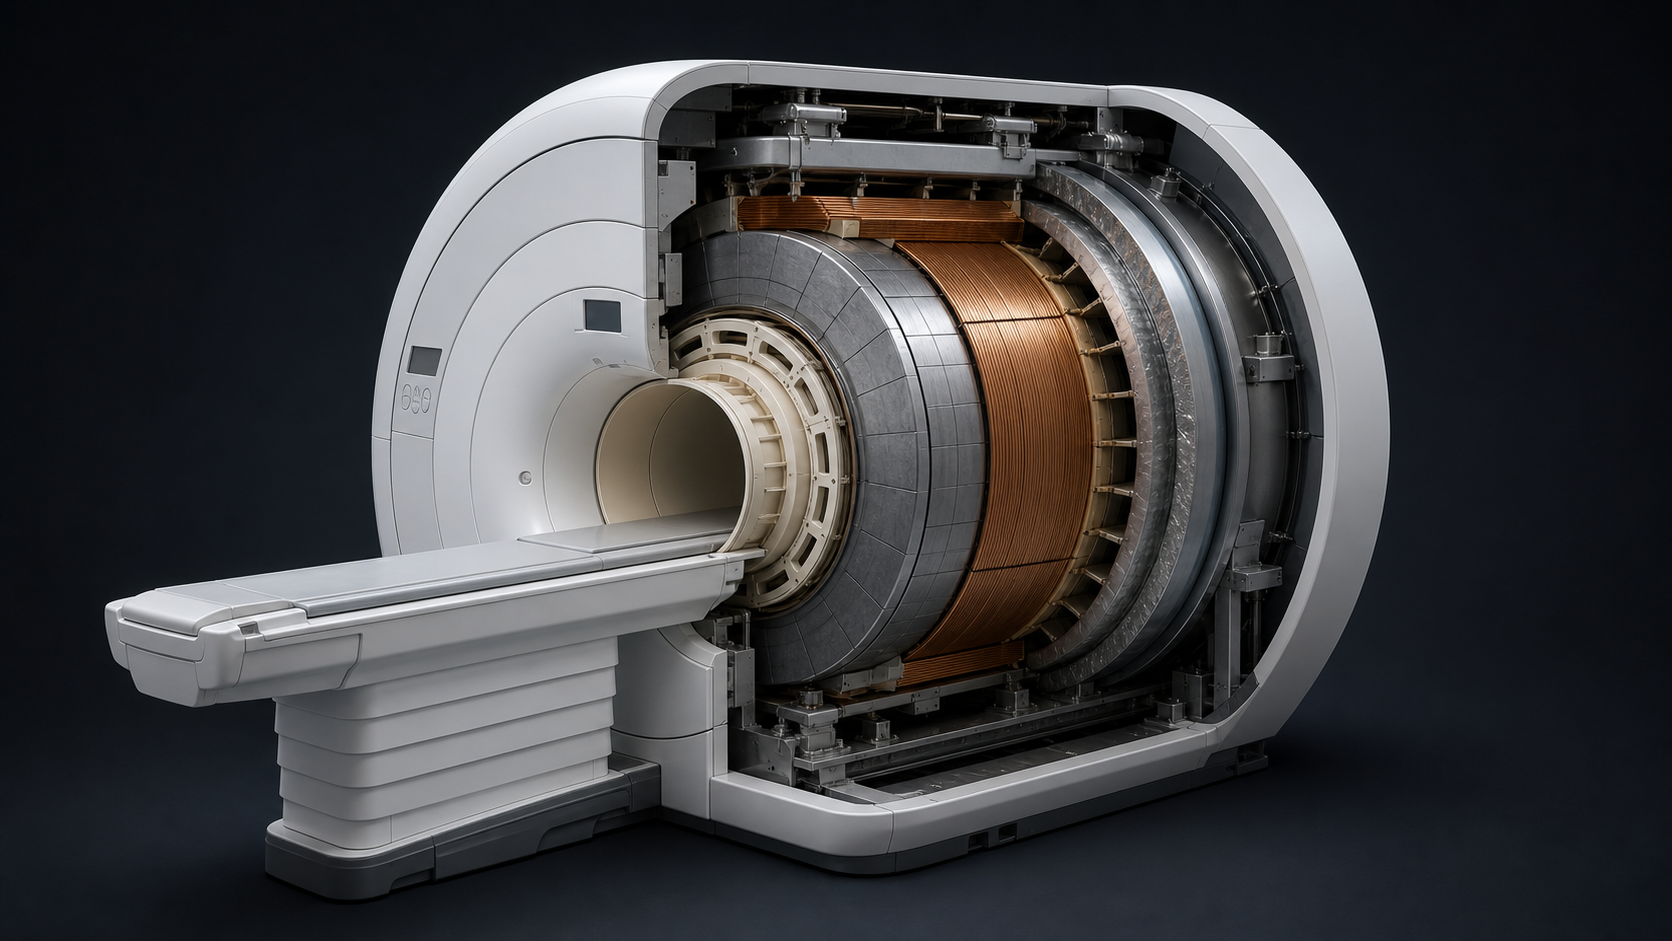
MRI Scanner Cutaway
Click on any labeled structure to learn its function.
A modern closed-bore superconducting MRI scanner is built as nested cylindrical systems: outer housing, cryostat, main magnet, shim hardware, gradient coils, RF body coil, then the patient bore and table. Exact vendor layouts vary, but this order is the standard teaching model.
MRI Pulse Sequences
A pulse sequence is a programmed series of RF pulses, gradient pulses, and timing parameters that determines image contrast and quality. TR and TE are the two key timing parameters.
Pulse Sequence Family Tree
All clinical MRI sequences descend from three echo-generation strategies. Each family controls contrast through different combinations of RF pulses and timing.
Sequence Lab
Change scan parameters and watch the generated image contrast respond. The simulator uses simplified teaching values, so it shows the relationship between TR, TE, flip angle, tissue signal, scan time, and image noise.
Generated MRI Preview
| Sequence | TR | TE | Key Use | Fat | Water/CSF |
|---|---|---|---|---|---|
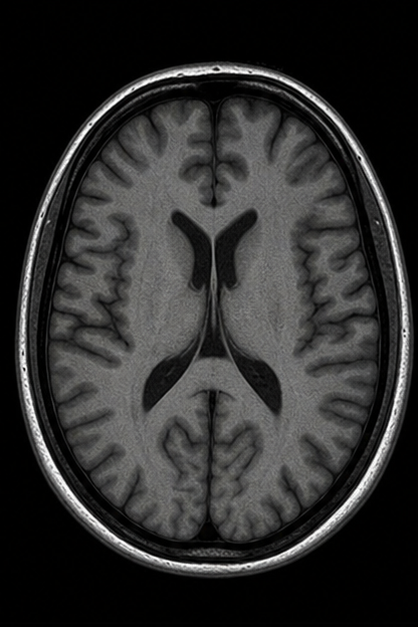
| T1-Weighted (SE) | Short (<700ms) | Short (<30ms) | Anatomy, post-Gd, fat | Bright | Dark |
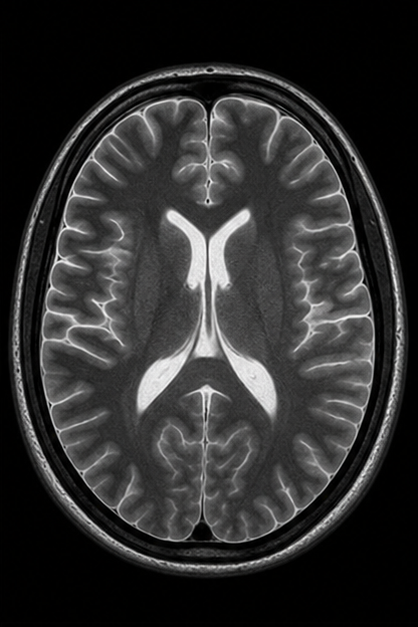
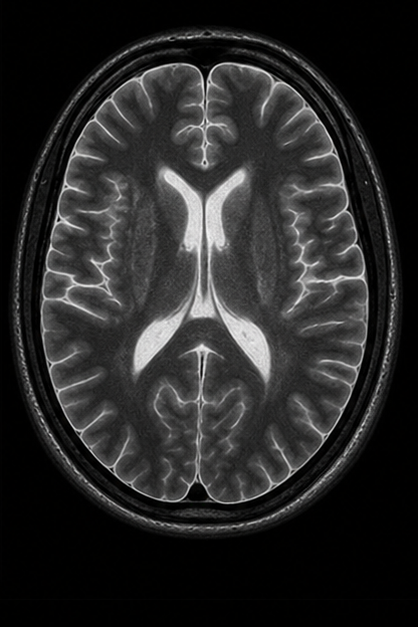
| T2-Weighted (SE) | Long (>2000ms) | Long (>80ms) | Pathology (edema, tumor, fluid) | Intermediate | Bright |
| PD-Weighted | Long | Short | Cartilage, menisci | Bright | Intermediate |
| FLAIR | Very long | Long + TI | MS plaques, subarachnoid lesions | Variable | Dark (suppressed) |
| STIR | Long + TI | Long | Bone marrow edema, soft tissue | Dark (suppressed) | Bright |
| GRE / FLASH | Short | Variable | Fast imaging, dynamic, cardiac | Variable | Variable |
| DWI | Long | Long | Acute stroke, abscess, tumor grade | Dark | Variable |
Memory trick: "Bright Fat on T1, Bright Water on T2."
Short TR/TE → T1W | Long TR/TE → T2W | Long TR + Short TE → Proton Density
MRI Safety
MRI safety is one of the most critical topics in the field. The main hazards are the static field (projectile risk), gradient fields (noise, PNS), RF fields (heating/SAR), and implant compatibility.
🚫 Absolute Contraindications
Devices that must not enter the MRI environment:
- Certain cardiac pacemakers (older models)
- Ferromagnetic aneurysm clips
- Cochlear implants (non-MRI compatible)
- Certain neurostimulators
- Intraocular metallic foreign bodies
- Ferromagnetic vascular stents (<6 weeks post-placement)
⚠️ Conditional Items
May be MRI-compatible — requires device verification:
- Modern pacemakers (MRI-conditional label)
- Joint replacements (most are safe)
- Dental implants & orthodontic brackets
- Intrauterine devices (IUDs)
- Insulin pumps (usually removed)
- Drug infusion pumps
✅ Generally Safe
Items typically MRI-safe (verify individually):
- Titanium implants (non-ferromagnetic)
- Most surgical clips (>6 weeks)
- Cardiac stents (>6–8 weeks post-placement)
- Non-ferromagnetic hip prostheses
- Jewelry (remove if possible)
- ECG monitoring (MRI-compatible leads)
Projectile Effect (Zone IV risk): Ferromagnetic objects become dangerous missiles when brought near the scanner bore. Always screen patients and staff before entering Zone III/IV. The static magnetic field is ALWAYS ON — even when no scan is in progress.
Pregnancy: MRI is generally considered safe after the first trimester. Gadolinium contrast is avoided in pregnancy unless absolutely necessary (crosses placenta). No ionizing radiation risk.
Clinical Applications
MRI provides the best soft-tissue contrast of any imaging modality. Click any card below to explore typical sequences, findings, and clinical pearls for each application.
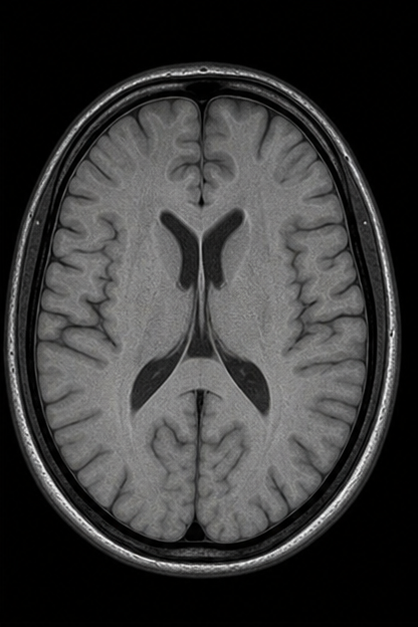
Neuroimaging
Brain tumors, MS plaques, stroke, white matter disease, cerebral hemorrhage, and fMRI for surgical planning. MRI is the gold standard for most CNS pathology.
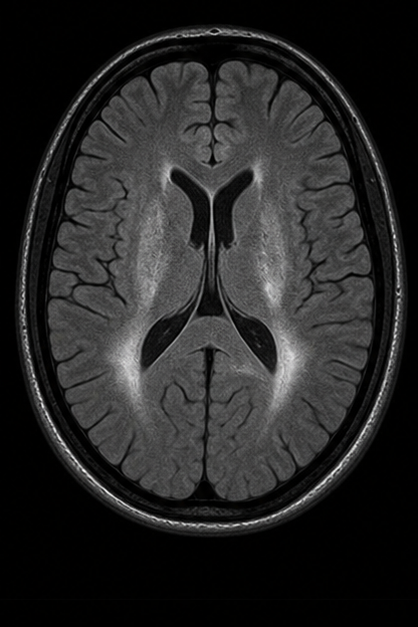
- T2 FLAIR
- MS plaques, periventricular lesions, subarachnoid disease
- DWI / ADC
- Acute stroke (restricted diffusion within minutes), abscess vs. tumor
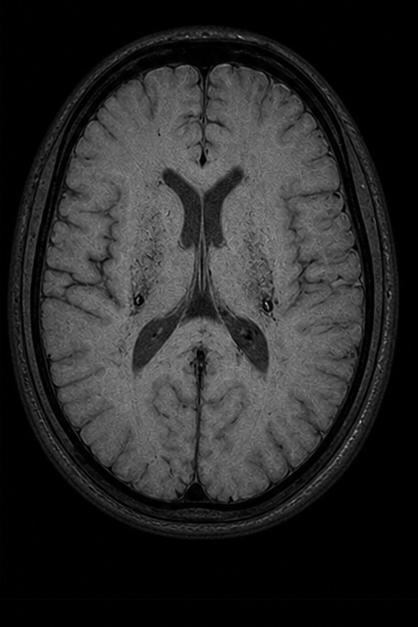
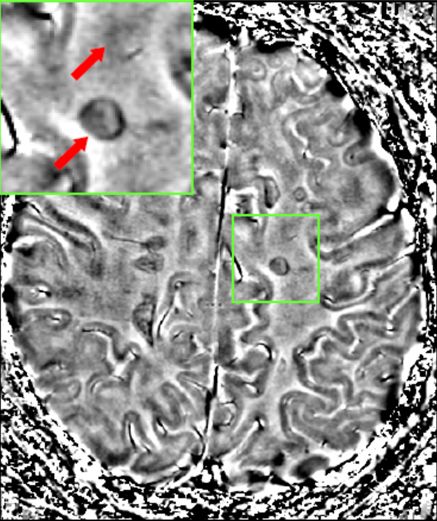
- SWI / GRE
- Microbleeds, cerebral amyloid angiopathy, cavernomas, calcification
- T1 + Gd
- Blood–brain barrier breakdown, tumor enhancement, leptomeningeal disease
DWI hyperintensity + ADC hypointensity = acute infarction with >95% sensitivity within the first 6 hours. Always review both maps together.
Musculoskeletal
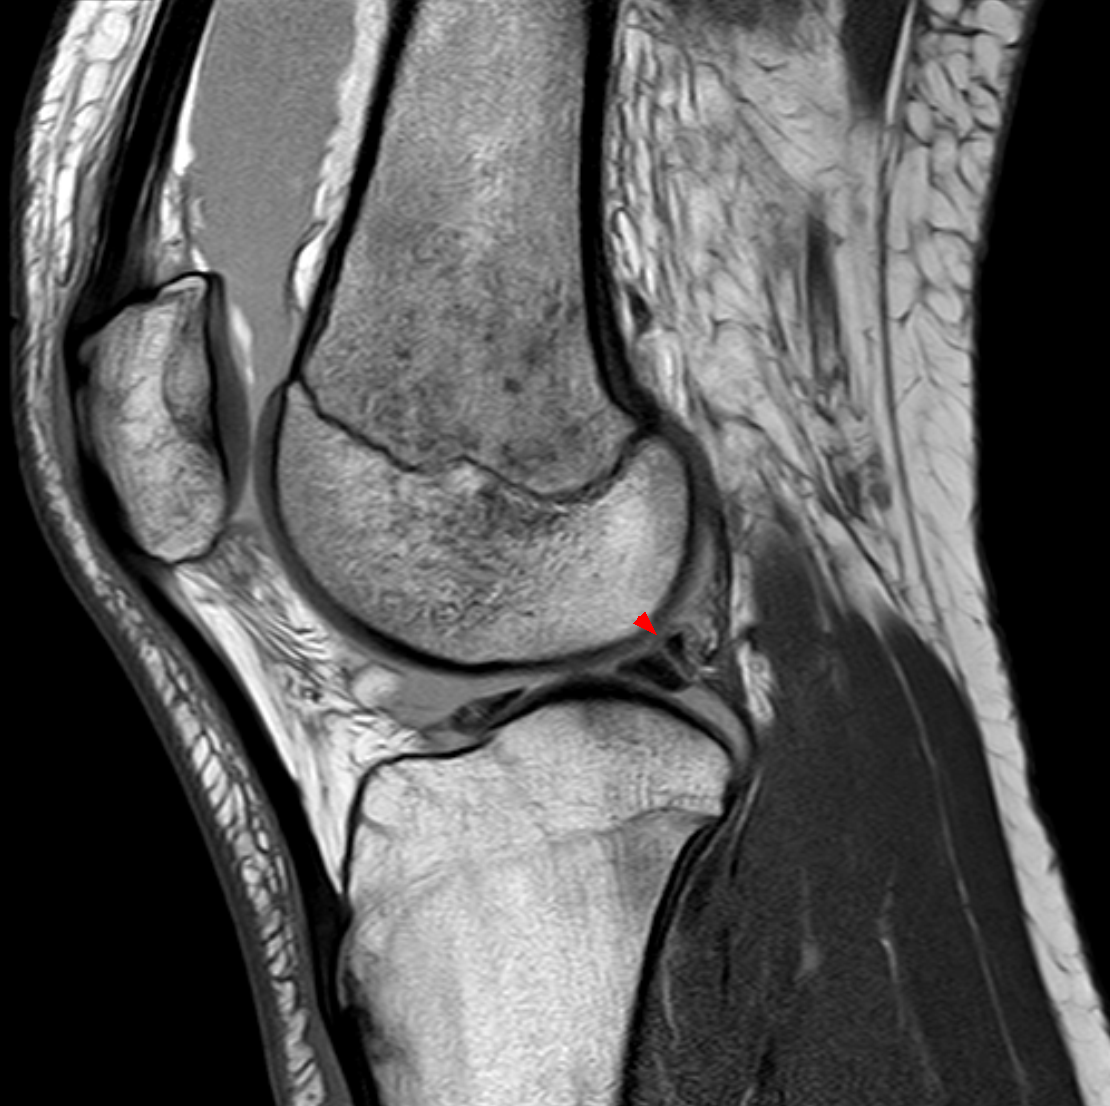
Rotator cuff, ACL/PCL tears, meniscal tears, bone marrow edema, avascular necrosis, stress fractures, and soft tissue tumors.
- PD Fat-Sat
- Meniscal tears (high signal reaching articular surface), cartilage defects, ligament integrity
- STIR / T2 FS
- Bone marrow edema (stress fracture, contusion), joint effusion, soft tissue fluid
- T1 SE
- Anatomy reference, marrow replacement (metastasis, myeloma), fracture lines
- 3D GRE
- Thin-slice cartilage mapping (T2 mapping, dGEMRIC), ligament 3D reconstruction
A meniscal tear must show signal contacting an articular surface on two consecutive slices (or one slice in two planes) to be called a true tear — intrameniscal signal alone is myxoid degeneration (grade I–II).
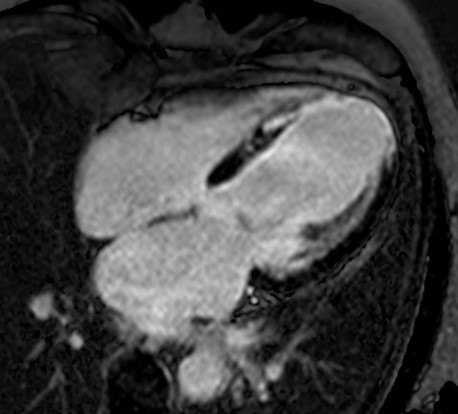
Cardiac MRI
Myocardial viability, cardiomyopathy assessment, congenital heart disease, and pericardial disease. Gold standard for myocardial fibrosis via late gadolinium enhancement (LGE).
- SSFP Cine
- Wall motion, ejection fraction, ventricular volumes, valve function
- LGE (IR-GRE)
- Myocardial scar/fibrosis (ischemic: subendocardial → transmural; non-ischemic: mid-wall/epicardial)
- T2 STIR / T2 mapping
- Myocardial edema (acute MI, myocarditis, takotsubo, transplant rejection)
- T1 mapping + ECV
- Diffuse fibrosis quantification; amyloidosis, Fabry, Anderson-Fabry disease
LGE pattern tells the story: subendocardial = ischemic (MI); mid-wall = dilated cardiomyopathy/myocarditis; epicardial = sarcoidosis; subendocardial + RV = amyloidosis; global subendocardial (“zebra”) = cardiac amyloid.
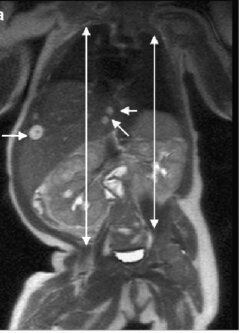
Abdomen & Pelvis
Liver lesion characterization, prostate cancer (mpMRI), rectal cancer staging, endometriosis, adrenal tumors, and MRCP for the biliary tree.
- T2 HASTE / TSE
- Liver lesion morphology, MRCP (heavily T2W for bile/pancreatic ducts), cyst vs. solid
- DWI / ADC
- Liver lesion cellularity (malignant = restricted), prostate cancer detection, lymph node assessment
- Dynamic T1 FS +Gd
- Arterial, portal venous, delayed phases for liver lesion characterization (hemangioma, HCC, metastasis)
- mpMRI Prostate
- T2 + DWI + DCE (PI-RADS reporting); gold standard for clinically significant prostate cancer detection
A hemangioma shows peripheral discontinuous nodular enhancement with centripetal fill-in on delayed phases (“filling in from outside in”). HCC shows arterial hyperenhancement with washout on portal venous/delayed phases.
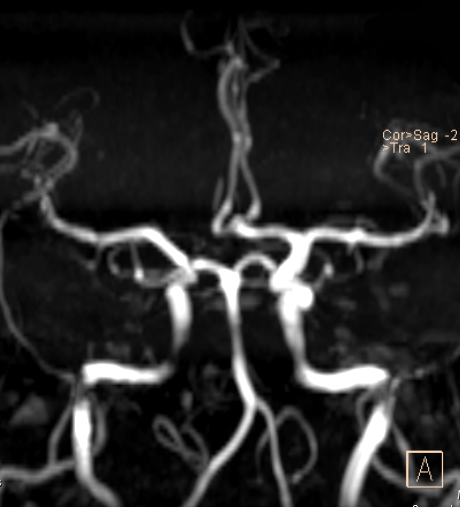
MR Angiography
Renal, carotid, and intracranial vessel imaging without ionizing radiation. Time-of-flight (TOF) and contrast-enhanced MRA techniques provide high-resolution vascular detail.
- 3D TOF MRA
- No contrast needed; inflowing unsaturated blood appears bright against saturated stationary tissue. Best for intracranial and carotid arteries.
- CE-MRA
- Gadolinium bolus timing with rapid 3D GRE acquisition. Aortic arch, renal arteries, peripheral runoff. Gold standard for vascular mapping.
- Phase Contrast MRA
- Quantifies flow velocity and direction. Used for CSF flow studies, cardiac output, shunt quantification, and venous imaging.
- 4D Flow MRI
- Time-resolved 3D phase contrast. Wall shear stress, pressure gradients, flow patterns in aneurysms and congenital heart disease.
TOF MRA signal loss can mimic stenosis in regions of turbulent or slow flow. Always correlate with source images, not just MIP reconstructions. CE-MRA reduces these flow-related artifacts significantly.
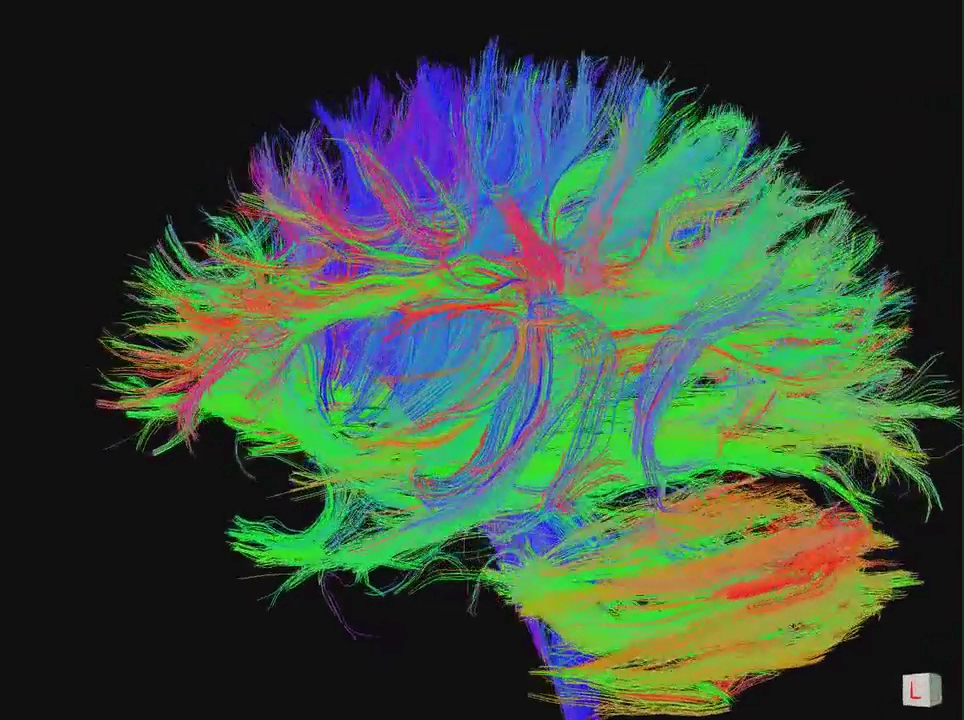
Advanced Techniques
fMRI for brain activation mapping, DTI tractography for white matter pathways, MR spectroscopy for metabolite analysis, and perfusion imaging for hemodynamics.
- BOLD fMRI
- Blood oxygenation level–dependent contrast. Maps brain activation during tasks or at rest (rs-fMRI). Pre-surgical motor/language mapping.
- DTI / Tractography
- Measures water diffusion directionality in white matter. Maps corticospinal tract, arcuate fasciculus, optic radiation for surgical planning.
- MR Spectroscopy
- Measures metabolites: NAA (neuronal health), choline (membrane turnover), creatine (reference), lactate (anaerobic metabolism), lipid (necrosis).
- Perfusion MRI
- DSC (dynamic susceptibility contrast) and ASL (arterial spin labeling). CBF, CBV, MTT maps for tumor grading and stroke assessment.
In brain tumors, elevated choline with depressed NAA suggests neoplasia. A lactate peak indicates anaerobic metabolism (high-grade or ischemia). Lipid peaks suggest necrosis (glioblastoma vs. metastasis).
Slice by Slice
CT Scan — explore the rotating gantry and cross-sectional anatomy.
Explore CT Scan →